Introduction | Tank – How to | Tank – Examples | Atmospheric_Examples | Theory | For_Teachers | Wiki
Fig.1 shows a sequence of pictures charting the evolution of convection triggered by heating from below in to a two-layer system. In the first panel one observes potassium permanganate streaks formed by crystals falling through the fluid after they have been dropped in from above. The fresh water above is dyed blue, the salty water below is clear, forming a two-layer stratification. Thermals can be seen rising from the bottom of the tank, entraining fluid as they rise. Parcels overshoot the level at which they become neutrally buoyant and brush the lighter fluid above, generating gravity waves on the inversion before sinking back into the convecting layer beneath. In this experiment the inversion is rather strong so that penetration from below in to the layer above is rather limited.
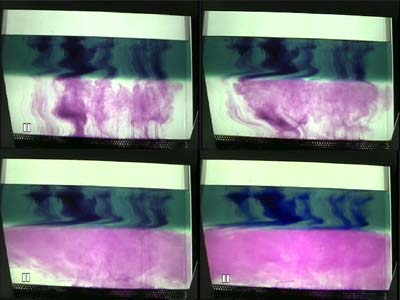
Fig.1 A sequence of photographs charting the evolution of convection triggered by heating from below in a two-layer system. The distortion of the perspective is due to the fact that the scene is being viewed from a camera above through a tilted mirror.
Fig.2 shows a close-up of convection in to a linearly (temperature) stratified fluid heated from below. The horizontal lines are 2cm apart.
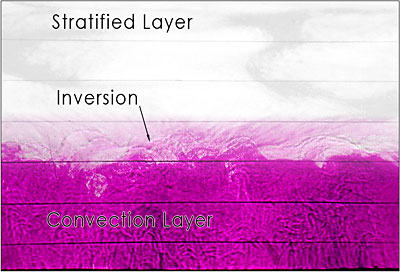
Fig.2 A snapshot of the convecting boundary layer in the laboratory expriment. Note the undulations on the inversion caused by convection overshooting the well mixed layer below into the stratified layer above.
Fig.3 shows a timeseries of T measured by thermometers at various heights above the bottom in the experiment shown in Fig.2. Initially, there is a temperature difference of some 18 degrees C from top to bottom. After the heater is switched on, T increases with time, first for the lowermost thermometer but subsequently, as the convecting layer deepens, for thermometers at each successive height as they begin to measure the temperature of the convecting layer. Note that by the end of the experiment, T is rising simultaneously at all heights within the convection layer. We see, then, that the convection layer is well mixed, i.e., is essentially of uniform temperature. Closer inspection of the T(t) curves reveals fluctuations of order ± 0.1 degrees C associated with individual convective events within the fluid. Note also that T increases at a rate that is less than linear.
Fig.3 Temperature time series measured by 5 thermometers spanning the depth of the fluid at equal intervals. The lowest thermometer is close to the heating element. We see that the ambient fluid initially has a roughly constant stratification, somewhat higher near the top than in the body of the fluid. The heating pad was switched on at t=150s. Note how the readings converge on to one line as the well-mixed layer deepens over time.