Introduction | Tank – How to | Tank – Examples | Atmospheric_Examples | Theory | For_Teachers | Wiki
The stratified tank experiment is compared to atmospheric observations of dry convection occurring over desert regions. Since air is a compressible fluid, we will plot vertical profiles of potential temperature instead of temperature. See theory for more on dry-convection.
Fig.1 shows a vertical profile of potential temperature at Las Vegas at 5am (dawn) on August 29th, 2007. This plot resembles the initial temperature profile in the stratified tank experiment before the heater is turned on. At dawn, the sun is below the horizon: without a heating source, the atmosphere retains a stable profile in which potential temperature increases with height.
Fig. 1 Potential Temperature profile over Las Vegas on August 29th, 2007 at 12 GMT, which is 5am local time, i.e. early in the morning. With the Sun still below the horizon, there is no heating source for the convective layer to form. As a result, the atmosphere remains linearly stratified. Click on the figure to find out how to plot this, and similar data.
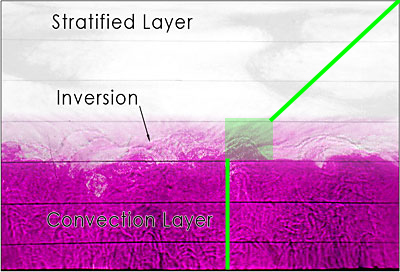
Fig. 2 shows a similar profile at Las Vegas twelve hours later at 5pm, in the late afternoon. The sun has been overhead for several hours and generated a heat source near the ground, which is represented by the heating pad in the experiment. We know that the ground continues to heat the air above it, because of the presence of a well defined super-adiabatic layer at 925mb. Throughout the day, the air above the ground heats and rises in convection cells. The cells rise until they reach air of similar potential temperature. As the ground temperature increases throughout the day, the convective layer will continue to grow in thickness. Much like the tank – see Fig. 3, the air within the convection layer is well mixed (uniform potential temperature), while above the convective layer, the atmosphere remains stable. The convective layer remains capped by the stable layer above as long as the potential temperature above is greater than that of the convective layer below.
Fig. 2 Potential Temperature profile over Las Vegas on August 30th, 2007 at 00GMT, i.e. 5pm local time, late afternoon. The Sun has heated the ground for most of the day, creating a convective layer (one of neutral stability) extending up to the 600mb level. Above, the atmosphere is still stable. Click on the image to learn how to plot this, and similar data.