Introduction | Tank – How to |Tank – Examples | Atmospheric – Examples | Theory
Slowing the tank down from a rotation rate of 15rpm to 14rpm results in the Rossby waves shown in the movies below (click on the images to play the movies).
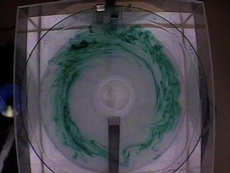
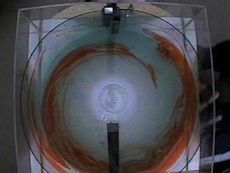
Fig.1. Real time movies of Rossby waves generated by the barrier. The Rossby waves are clear to the right of the barrier, particularly towards the end of the movies. Click on the images to play the movies.
We can now look at how closely the observed wavelength of stationary Rossby waves relates to theoretical predictions. Theory tells us that
λ2 = 4π2 H r ΔΩ / (Ω ∂H/∂r) (1)
So we’ll measure to see whether λ follow the predictions made in the theory section for our setup:
λ2 ≈ 5 r (r – 0.05) / 2 m2 (2)
Two examples are shown below.
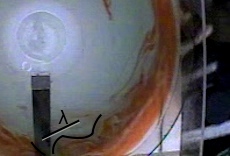
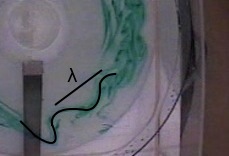
Fig.2. Images taken from the movies marked with the Rossby waves close to the barrier.
At a radius of approximately 0.15m (measured from the center of the tank) as in the images above, the expected wavelength of the stationary Rossby waves would be λ2 ∼ 5 x 0.15 x (0.1) / 2 m2, i.e., λ ∼ 0.2m, or 20cm. At approximately 10cm, the observed wavelength in the above experiments is certainly of this order.
Fig.3. Sample trajectory of a particle travelling anticlockwise around the ‘pole’ following slow-down of the tank – note that the path followed by the particle corresponds directly to a stationary Rossby wave pattern. Again Ω is approximately 1.5/s and ΔΩ 0.1/s. The slightly longer wavelength compared to the previous images is due to the wave being further from the center of the tank. The trajectory is over a time period of 90s.