Observed data of hurricanes flow can be used to explore the balance of forces in the region of strong curved flows.- see list of interesting cases in For teacher.
Hurricane Erin
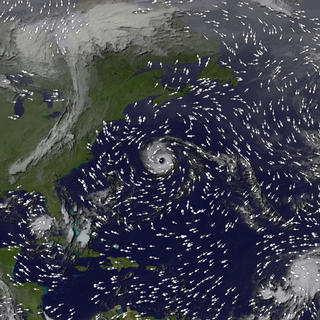
Fig. 1: Hurricane Erin surface winds on September 10, 2001. (Click on image to see animation). This animation represents a single measurement taken by the SeaWinds instrument on the QuikSCAT satellite, taken at 14:27:00 UTC on September 10, 2001. For more see:http://svs.gsfc.nasa.gov/vis/a000000/a002800/a002896/.
More suggestions on how to use Scatterometer imagery together with the balanced motion experiment can be found in For Teacher.
Hurricane Katrina
Fig. 2: Infrared satellite image of Hurricane Katrina on August 29th, 2005. (Click on image to see Katrina in Motion)
As discussed in the theory section, the observed regimes can be interpreted in terms of the Rossby number:
Ro = vobserved /(fr)
a dimensionless number that describes the ratio of centrifugal acceleration to the Coriolis acceleration.
Using the observed wind and radius from the center of Katrina, we can compute the Rossby number at several locations around the storm- see Fig. 3.
Fig. 3: Observed wind velocity field for Hurricane Katrina at 700 hPa on 8/29/05, 00 GMT . The purple numbers indicate the Rossby number calculated at these locations. (Click on image to see how to create your own plot).
A pattern emerges similar to that observed in the radial inflow experiment. In the center of the hurricane, the Rossby number is greater than one. Moving towards the outside of the storm, the Rossby numbers decreases and approaches zero in the outer regions, as schematically summarized in Fig. 4 below.
Fig. 4: General pattern of Rossby numbers around Hurricane Katrina.
Three regimes can be seen, as in the radial inflow experiment:
- If Ro<<1, the so called geostrophic balance, the centrifugal force is small and the Coriolis force balances the pressure gradient force. This geostrophic balance occurs far from the center of the storm (where the curvature is small), or, in the radial inflow experiment, near the edge of the tank.
- If Ro>>1 then we have cyclostrophic balance, the centrifugal force is very large and balances the pressure gradient force. Cyclostrophic balance is observed near the center of storm systems or, in the experiment, near the drain, where the curvature is very large.
- Lastly, if Ro~1, all three forces (centrifugal force, Coriolis force and pressure gradient force) are important, resulting in the so called gradient wind balance. This balance pertains at a moderate distance away from a storm center or the drain in the experiment.
Finally to verify these regimes, we plot the geostrophic wind for hurricane Katrina, Fig. 5
Fig. 5: Geostrophic wind velocity field for Hurricane Katrina on 8/29/05 at 700 mb. (Click on image to see how to create your own plot)
When compared to the observed winds in Fig. 3, the geostrophic winds are much higher than the observed winds in the inner part of the hurricane, consistent with a large Rossby number. Outside of the storm, on the other hand, the geostrophic winds are of the same order as the observed winds consistent with small Rossby number.
The Rossby number can be conveniently expressed in terms of the geostrophic and observed wind as follow:
Ro = (vgeo /vobs) – 1
For more see theory section.