Introduction | Tank – How to | Tank – Examples | Ocean – Examples | Theory
The purpose of this project is to generate Rossby waves in the laboratory and study their underlying mechanism. Rossby waves in the ocean, as seen from satellite altimetry, are also presented.
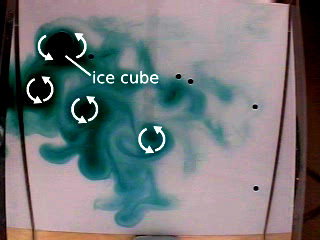
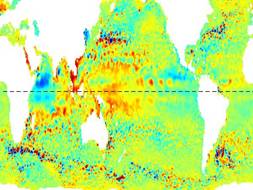
Fig.1 (Left) Cyclonic vortices created by a melting ice cube drifting ‘westward’ in a rotating fluid above an inclined beta-plane, shallow representing polar latitudes at top, deep representing equatorial latitudes at bottom – see setup in Tank – How to. (Right) An instantaneous plot of the sea surface height of the ocean measured by satellite altimetry. The small-scale features propagate westward under the influence of the beta affect. Click on images for animation.
The laboratory experiment illustrates the fundamental mechanism behind Rossby waves by investigating the ‘westward’ drift of a vortex induced by a melting ice cube in a rotating fluid of variable depth, as shown on the left. The varying depth of the tank mimics the variation in the depth of a spherical shell of fluid measured in the direction parallel to the rotation vector on the sphere: i.e. shallow is poleward, deep is equatorward. Rossby wave theory is used to interpret the rate of drift.
The fundamental mechanism behind the experiment is illustrated in Fig.2 below.
Fig.2 (Left) Sketch illustrating the mechanism behind westward drift of vortices explored in the experiment. The advection of surrounding fluid induces cyclonic and anticyclonic vorticities due to stretching and squeezing of Taylor columns, which combine to induce a leftward drift of the vortex structure along lines of constant thickness. In the Northern Hemisphere (as drawn), the vortex moves with the thin layer side on its right (i.e. westwards); the direction is opposite in the Southern Hemisphere (from Cenedese and Whitehead, 2000, based on Cushman-Roisin 1994).
Rossby waves are a ubiquitous feature of ocean circulation and are strikingly evident in satellite altimetry, as shown in the image on the right of Fig.1. We present movies of the evolving surface pressure of the ocean and compare them with the speed of first baroclinic mode internal Rossby waves.