Introduction | Tank – How to | Tank – Examples | Theory | Wiki
Theory tells us that the mass transport in an Ekman layer, MEk, is given by:
where τwind is the stress applied by the wind at the surface, z is a unit vector pointing vertically upwards, f is the Coriolis parameter (in our laboratory experiment, f = 2 Ω) and ‘x’ is the vector product. We thus see that the mass transport of the Ekman layer is exactly to the right of the surface wind (in the northern hemisphere). The above equation determines MEk which depends only on τwind and f. It does not predict typical velocities or boundary layer depths which depend on the details of the turbulent boundary layer. A more complete analysis (carried out by Ekman, 1905) shows that the horizontal velocity vectors within the layer trace out a spiral, as shown in Fig.1. But irrespective of these details, the transport is to the right of the applied stress.
In our laboratory experiment the Ekman layers (both at the top and the bottom) are very shallow, perhaps a few mms in depth. The majority of the fluid column is in geostrophic balance.
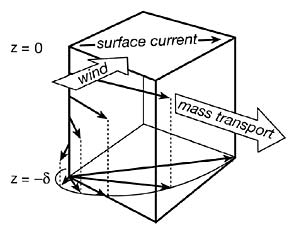
Fig.1 The mass transport of the Ekman layer is directed to the right of the wind in the Northern Hemisphere. Theory suggests that horizontal currrents, uag, within the Ekman layer spiral with depth as shown.
The state of affairs in our laboratory experiment is shown in Fig.2. When the fans are arranged to create an anticyclonic (cyclonic) vortex the ageostrophic flow at the surface is directed ‘to the right’ of the wind direction and hence induces convergence (divergence) and downwelling (upwelling):
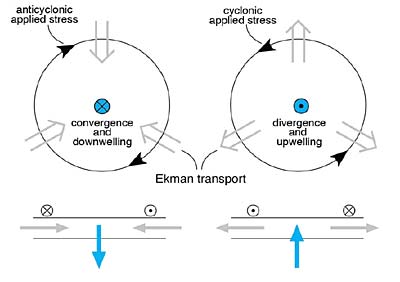
Fig.2 Ageostrophic flow at the surface induced by the action of the wind: anticyclone of left, cyclone on right.
The situation is reversed at the bottom of the tank, however. There the stress opposes the direction of the large-scale interior flow inducing ageostrophic flow at the bottom that is directed outward (inward) in an anticyclone (cyclone), as shown in the diagram below:
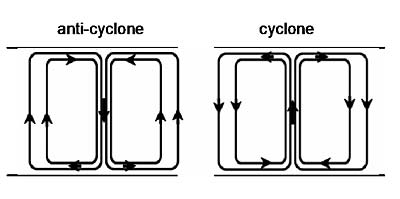
Fig.3 Schematic diagram showing ageostrophic vertical overturning circulation in an anticyclonic and in a cyclonic vortex.
The sense of circulation sketched in Fig.3 is very evident in the patterns of permanganate streaks on the bottom observed in the experiment.