Here we present some oceanographic phenomena that have contact points to the dye stirring experiment. In each example it is instructive to estimate the Rossby number and so determine to what extent the earth’s rotation plays a role – see theory section for definition and discussion of the Rossby number.
Oil Spill in the Persian Gulf
Oil distribution (left) and time-integrated oil concentration (right) in the aftermath of an oil spill in the Persian Gulf. The time elapsed from the beginning of the animation until the oil reached the southern shoreline was about 70 days. Note how the oil does not diffuse away from the release point; rather, it flows from the source in a rather narrow stream.
Estimate the Rossby number associated with the flow. How does it compare to typical Rossby numbers in your rotating tank and in the atmosphere?
Tracer Release off the Massachusetts Coast

The Tracer Release Laboratory at the Woods Hole Oceanographic Institution performed this dye release experiment over the mid-continental shelf south of Martha’s Vineyard in 1997. The three smaller maps show the location of dye 9, 51, and 106 hours after release. The dye does not disperse evenly but is carried away in filaments of high concentration. Note also the dispersion of dye in the vertical over time shown in the lower left plot.
Estimate the Rossby number of the tracer release. What do you conclude about the role of rotation?
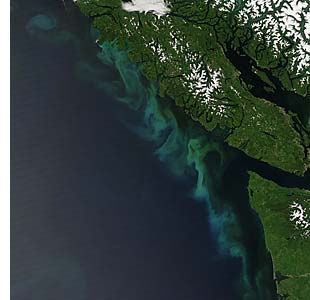 These green swirls in the eastern Pacific of Vancouver Island are phytoplankton, tiny plants that tend to proliferate in light-filled, nutrient-rich waters. Off the coast of Vancouver Island and Washington State, phytoplankton blooms tend to happen when winds blow down the coast from the north. The winds push the ocean®s surface water west, out to sea. Deep water rises up to replace the wind-blown surface water, and it carries the nutrients needed to support phytoplankton blooms. You can learn more about these phytoplankton and see more photographs here.
Estimate the Rossby number, assuming currents are moving at a speed of 0.5 m s-1. How does it compare to the above examples?
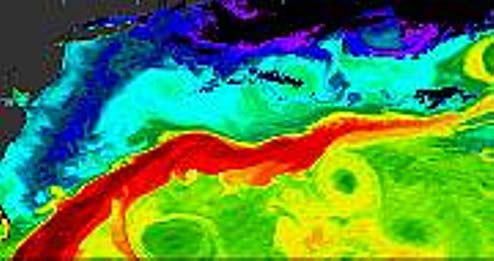
The Gulf stream carries warm water, and thus heat, northeastward along the U.S. coast and to the central North Atlantic. The warmest SSTs shown above are indicated by red, while the coldest are purple. Note the eddies and swirls in the flow pattern.
Estimate the Rossby number of the Gulf Stream, assuming a typical speed of 1 m s-1. How does it compare to the other examples?