Introduction | Tank – How to | Tank – Examples | Ocean – Examples | Theory
Altimetric observations of sea surface height (SSH) of the ocean show westward propagating phase anomalies in all of the major oceans except the Antarctic Circumpolar Current (ACC), the Kuroshio and the Gulf Stream, where, due to mean-flow advection, the propagation is eastward. Chelton and Schlax (1996) were the first to attempt to understand these observations in terms of linear, first baroclinic Rossby waves in a resting ocean in the long-wave limit.
To view a movie which clearly shows westward phase propagation, click on the images in Fig.1. On the left is the SSH, on the right is the vorticity field.
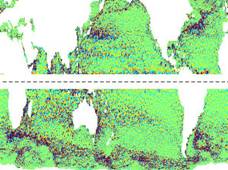
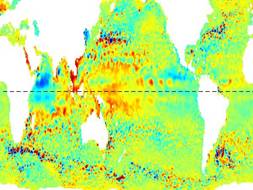
Fig.1 Movies showing 3 years of (left) sea surface height anomalies and (right) relative vorticity. Three years of data are plotted (first frame is Dec 14, 2005, last frame is Dec 3, 2008) from gridded weekly SSH anomalies computed with respect to a seven-year mean from AVISO(available here).The ‘y’ axis runs from -65 to 60 degrees of latitude and the color bars are-40cm to 40cm for SSH and (-1 to +1) x10-5 s-1 for relative vorticity, evaluated geostrophically. Between -5 to +5 degrees of latitude the vorticity is blanked out because the Coriolis parameter is very small there.
Fig.2 compares the observed phase speed of these signals with the prediction from linear Rossby wave theory assuming they have first baroclinic mode vertical structure and have a horizontal scale that is much larger than the first baroclinic deformation scale: i.e.
where K1 is the first deformation wavenumber and beta is the planetary vorticity gradient.
We see that linear Rossby wave theory in a resting, flat-bottomed ocean, does a remarkably good job at explaining the gross dependence on latitude of the observed phase speed. Much study has gone in to understanding the causes of the departure of this simple theory from observations. See Tulloch et al (2009) for a recent review.
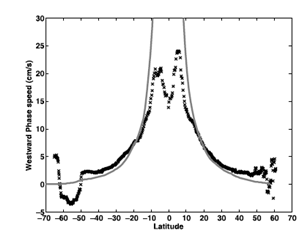
Fig.2 Westward phase speed of observed altimetric signals averaged from 170W to 120W in the Pacific (black crosses) plotted against the prediction from linear, first baroclinic, long Rossby wave theory (solid line).
Much study has gone in to understanding the causes of the departure of this simple theory from observations.